Size Exclusion Chromatography
Separate species by pore access and hydrodynamic behavior in the selected buffer.
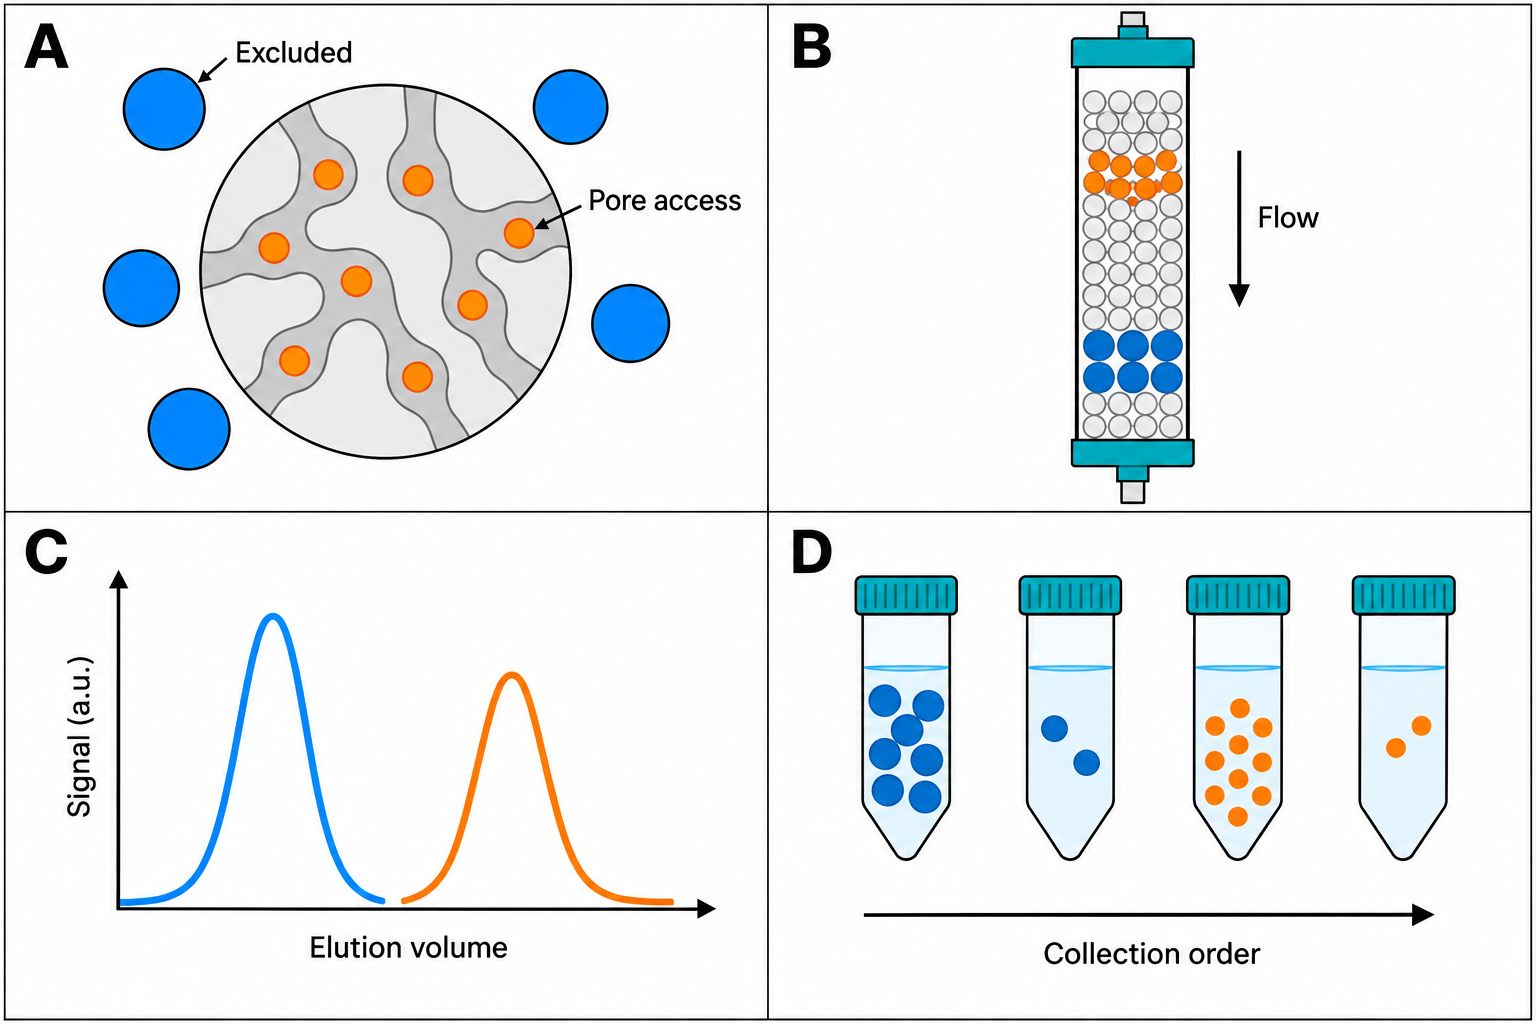
Principle
SEC columns are packed with porous beads. Species that access more pore volume generally elute later, while larger hydrodynamic species generally elute earlier. The observed behavior also depends on shape, hydration, conformation, oligomerization, buffer, and non-ideal interactions with the medium.
SEC is often selected for relatively mild, isocratic handling, but it does not itself demonstrate native structure or activity. An early-eluting feature can be consistent with aggregate or higher-order assembly, but it can also reflect anomalous hydrodynamics or interactions; confirm the assignment with a method suited to the question.
Running conditions
Select a column pore range and operating window from that column’s current instructions. Buffer, flow, sample volume, and load are method-development variables: assess resolution, recovery, stability, and unwanted interactions on the actual sample rather than applying a universal numeric recipe.
Reading the chromatogram
A typical protein SEC trace shows:
- Early material — species with lower pore access; test any aggregate/assembly assignment.
- Target-associated peak — a candidate pool, not an identity assignment.
- Later material — species with greater pore access, which may include small components.
Peak shoulders can arise from partial resolution, overload, heterogeneity, or non-ideal interactions. They are hypotheses to investigate, not automatic assignments of oligomeric or conformational state.
SEC chromatogram simulator
Two proteins on an idealized column. Elution position follows a globular-protein selectivity curve; peak width comes from plate number and sample volume. Change one control at a time and watch Kav, peak widths and Rs.
- Kav A / B
- 0.247 / 0.614
- Ve A / B
- 11.35 / 17.51 mL
- Width 4σ A / B
- 1.20 / 1.83 mL
- Rs
- 4.06
- V0 / Vt
- 7.2 / 22.1 mL
- Sample volume
- 240 µL
Idealized model: Kav from a logistic curve in log Mr for globular proteins (5% and 95% of the permeation plateau at the range limits), clamped between exclusion (V0) and total permeation (Vt); Ve = V0 + Kav(Vc − V0); σ² = Ve²/N + Vs²/12; w = 4σ; Rs = 2ΔVe/(w1 + w2). Equal amounts give equal peak areas. N is an effective protein plate number, assumed equal for both proteins; it is much lower than a column’s acetone-test specification. The Gaussian with added injection variance approximates a flat-topped band at larger sample volumes. Real peaks tail, non-globular shape changes elution, and interactions with the medium can delay species beyond Vt. Sources: Cytiva™, Size Exclusion Chromatography: Principles and Methods (Kav, Vt/Vc, Rs, sample volume); Groskreutz & Weber 2015 (variance additivity).
Column calibration
Choose standards appropriate to the column pore range and question, then build a calibration only under the stated method conditions. Kav = (Ve − V0) / (Vc − V0), where Ve is the analyte elution volume, V0 the void volume, and Vc the geometric bed volume (some texts write Vt for it; check the convention before comparing values). A log(molecular mass) versus Kav curve yields an apparent molecular mass relative to those standards—not an absolute mass, numerical size measurement, or identity assignment. Use an orthogonal method such as SEC-MALS, analytical ultracentrifugation, MS, or a validated reference method when the decision requires it.
Sources and scope
IUPAC Gold Book: distribution constant (exclusion) is the authoritative definition reference; direct access was limited in this review. Cytiva™ Superdex™ 200 Increase instructions for use (official, accessed 2026-09-25) illustrates method-specific operational and performance instructions. Cytiva™, Size Exclusion Chromatography: Principles and Methods (official handbook, read 2026-09-25) is the basis for the figures and simulator conventions. Consult the exact column manual for ranges and operating limits.
Try it on a trace
Open a two-column chromatogram in the workbench, or load the synthetic example. No account needed.
Open the workbench